 Chart-Output
- 1 Pick a chart
- 2 Make it yours

Alt text for this chart
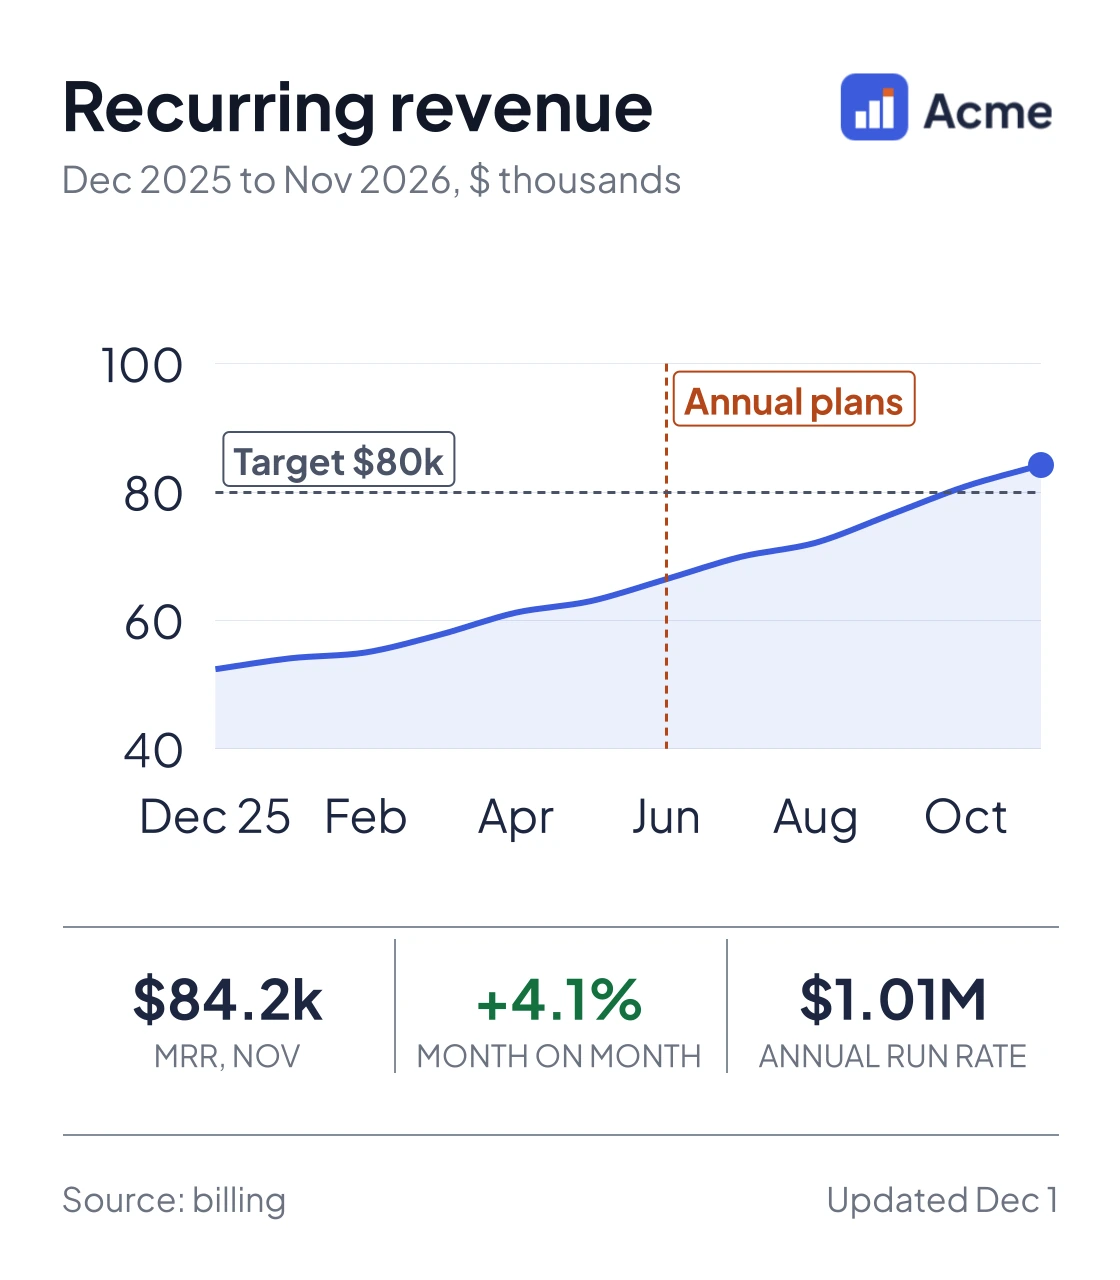
Line chart of monthly recurring revenue from December 2025 to November 2026. MRR rose from $52.4k to $84.2k, peaking at $84.2k in November. A marker at June shows when annual plans launched; the target is $80k.Line chart · One API request
Recurring revenue
A board-ready MRR chart with the month you launched annual plans marked on it. Change the numbers and the request below follows. Send it from Make, n8n, Zapier or a script, and the image comes back.
Columns: Month, MRR. Paste rows from a sheet, or type one per line.
2. The request that makes it
{
  "type": "line",
  "width": 560,
  "height": 640,
  "textScale": 1.8,
  "format": "png",
  "devicePixelRatio": 2,
  "data": {
    "labels": ["Dec 25", "Jan 26", "Feb", "Mar", "Apr", "May", "Jun", "Jul", "Aug", "Sep", "Oct", "Nov"],
    "datasets": [
      {
        "label": "MRR",
        "data": [52.4, 54.1, 55, 57.8, 61.2, 63, 66.4, 69.9, 72.1, 76.5, 80.9, 84.2],
        "borderColor": "#3c5cdd",
        "backgroundColor": "rgba(60, 92, 221, 0.10)",
        "fill": true,
        "borderWidth": 3,
        "tension": 0.3,
        "pointRadius": [0, 0, 0, 0, 0, 0, 0, 0, 0, 0, 0, 5],
        "pointBackgroundColor": "#3c5cdd"
      }
    ]
  },
  "annotations": [
    {
      "x": "Jun",
      "label": "Annual plans",
      "color": "#b4461a"
    },
    {
      "y": 80,
      "label": "Target $80k",
      "color": "#4a5368"
    }
  ],
  "options": {
    "plugins": {
      "legend": {
        "display": false
      }
    },
    "scales": {
      "x": {
        "grid": {
          "display": false
        },
        "border": {
          "color": "#e3e7ef"
        },
        "ticks": {
          "color": "#4a5368",
          "maxRotation": 0,
          "autoSkip": true,
          "maxTicksLimit": 6
        }
      },
      "y": {
        "beginAtZero": false,
        "min": 40,
        "border": {
          "display": false
        },
        "grid": {
          "color": "#e3e7ef",
          "drawTicks": false
        },
        "ticks": {
          "color": "#4a5368",
          "padding": 8,
          "maxTicksLimit": 5,
          "stepSize": 20
        }
      }
    }
  },
  "kpiStrip": [
    {
      "label": "MRR, Nov",
      "value": "$84.2k",
      "color": "#1d2640"
    },
    {
      "label": "Month on month",
      "value": "+4.1%",
      "color": "#13703f"
    },
    {
      "label": "Annual run rate",
      "value": "$1.01M",
      "color": "#1d2640"
    }
  ],
  "footer": {
    "left": "Source: billing",
    "right": "Updated Dec 1",
    "borderTop": true
  },
  "header": {
    "title": "Recurring revenue",
    "subtitle": "Dec 2025 to Nov 2026, $ thousands",
    "logoUrl": "https://www.chart-output.com/gallery/acme-logo.png",
    "logoHeight": 22
  },
  "theme": {
    "backgroundColor": "#ffffff",
    "textPrimary": "#1d2640",
    "textSecondary": "#4a5368",
    "gridColor": "#e3e7ef",
    "mode": "light"
  }
}
It carries this chart's colours in theme, so it runs on any account. To use your own logo and colours, swap theme for "brand": "your-kit-slug" (brand kits).
1,000 renders a month free. No card.
About this chart
- When to pick it
- Use it to show recurring revenue over a year, with the launch or event that moved it marked on the line.
- The data it takes
- Columns: Month, MRR. 2 to 24 rows. An optional target line.
- What it shows off
- Line, under Revenue. Brand kit, Event annotation, Target line, KPI strip.
- For scripts and agents
- This chart's request (JSON) · This page as Markdown · Every chart (JSON)
Questions
about this chart.
How do I make this recurring revenue chart with my own data?
Paste your numbers into the box on this page and the chart and its request update. To make it from your own workflow, send that request to POST https://www.chart-output.com/api/v1/render with a free API key; the response is the image.
What data does it take?
Columns: Month, MRR. 2 to 24 rows. An optional target line.
Can ChatGPT or Claude make this chart?
Yes. Add https://www.chart-output.com/mcp as a custom connector and ask for the chart; its render_chart tool takes this page's request and returns the image, with no API key. Or use "Copy prompt for your AI" on this page.
What does it cost?
The free plan includes 1,000 renders a month, with no card. Paid plans add more renders and remove the watermark.
What do I get back?
A finished image: PNG by default, or SVG, WebP or JPEG, and PDF on Pro. Set "format" in the request.
Or start from another chart
Revenue by planHow November MRR splits across plans, with each share printed on the chart.DoughnutRevenue bridgeWhat moved MRR from December to November: new business and upsell added, downsell and churn taken off, as steps.WaterfallSignups by channelStacked weekly signups for a growth review, with the channel split readable at a glance.Stacked barTrial-to-paid funnelWhere visitors drop off between the pricing page and a paid plan, labelled on the bars.Horizontal barTrials and conversion rateWeekly trials as bars with the trial-to-paid rate as a line on its own scale, so volume and quality read together.Bar and linePut it in a workflow
Ask your AI for a revenue waterfall chartGive it a before and after per line item and get a waterfall chart plus a summary of the biggest movers.GuideAdd a chart to an n8n workflowGoogle Sheets rows to a chart image in Slack or email, with one Code node and one HTTP Request node.GuideChart.js PDF reportsBuild automated PDF reports with chart visuals, without launching a headless browser.GuideAdd this chart to
your next report.
Send the request from the workflow that builds the report. 1,000 free renders a month, no card.
Get a free API keyEvery plan resets monthly. No automatic overage charges.