 Chart-Output
What changed this month? Ask your AI for a waterfall chart
Want to see the output first? Render a chart in the playground. No account needed.
In the sample data used in this post, revenue goes from $41,000 in October to $47,500 in November. That is the headline. The next question is which channels did it, and a waterfall chart is the picture built for that: it starts at October's total, steps up or down through each contributor, and lands on November's total.
The Chart-Output MCP server has a tool for it, render_waterfall. This guide shows what to give it, what comes back, and what it deliberately does not say. If the server is not installed yet, start with the CSV setup guide or the MCP setup page. Every number below is sample data for illustration.
Give it a before and after
There are two shapes of input. Pick whichever you have, and do not mix them in one request.
A before and after for each item
Revenue by channel, October to November:
Paid search: 18,000 to 23,100
Email: 9,000 to 11,300
Organic: 14,000 to 13,100
The change for each item, plus the starting total
Headcount started at 120. Engineering +6, Sales +3, Support -2.Item names must be unique, ignoring case, and can be up to 60 characters. You can send 1 to 100 items.
Ask for it
Name the periods and the number format:
Make a waterfall of revenue from October to November using the channel
numbers above. Format as dollars with no decimals and title it
"Revenue: October to November".
Your AI calls render_waterfall. This is the call that produced the image below:
{
  "title": "Revenue: October to November",
  "metric": "revenue",
  "start_label": "October",
  "end_label": "November",
  "number_format": { "prefix": "$", "maximumFractionDigits": 0 },
  "items": [
    { "name": "Paid search", "start": 18000, "end": 23100 },
    { "name": "Email", "start": 9000, "end": 11300 },
    { "name": "Organic", "start": 14000, "end": 13100 }
  ],
  "width": 696,
  "height": 460,
  "textScale": 1.35
}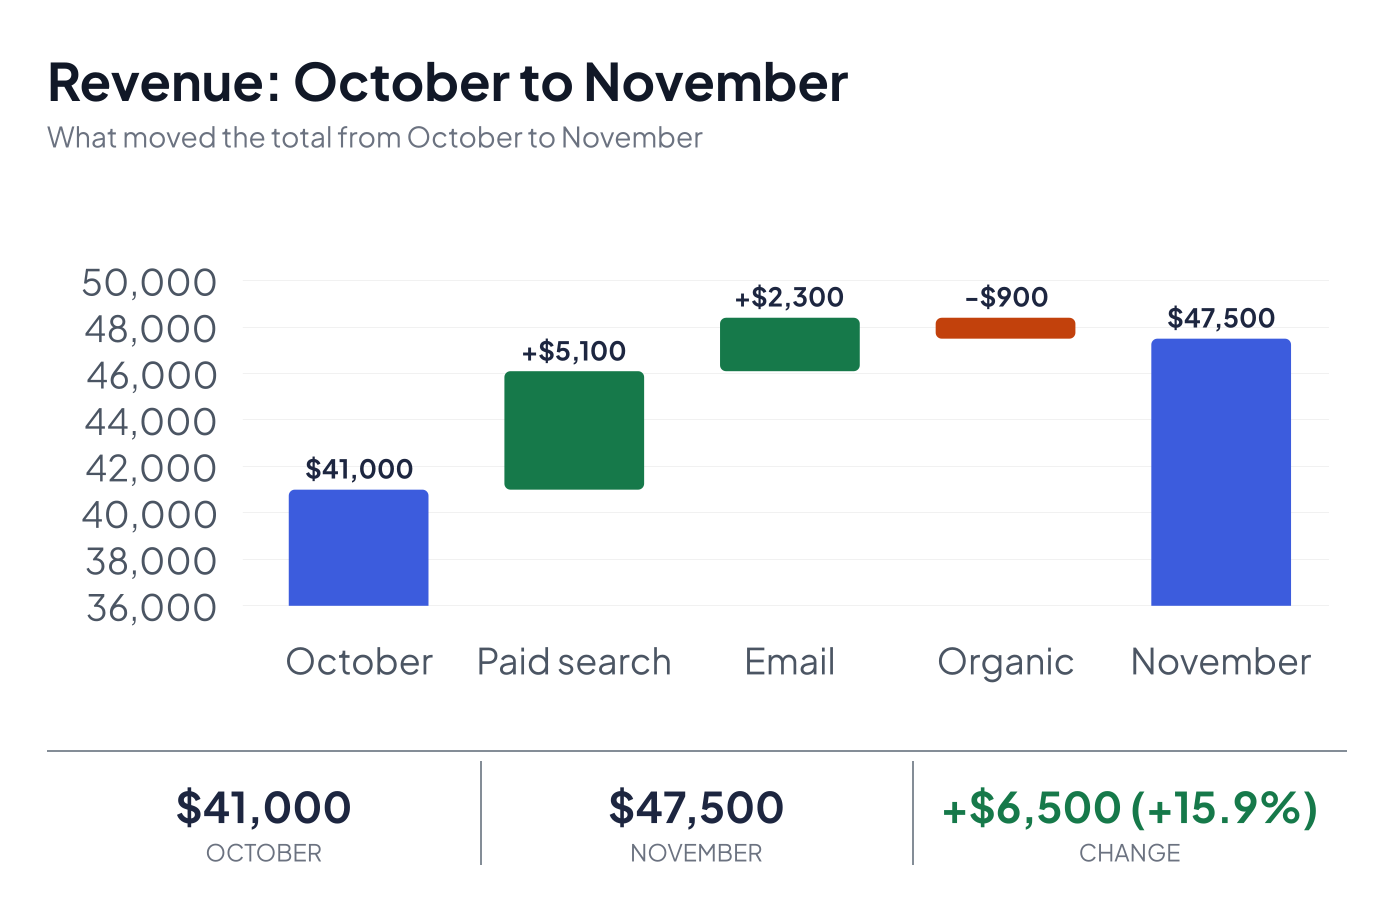
Rendered from the call above on a paid plan, so there is no watermark. Width, height and textScale are optional; they are set here so the text reads at its drawn size in this column.
The chart is a card: a header, the waterfall, and a strip with the start total, end total and change. Rises are green, falls are orange-red, and the totals use your brand color if you pass one. Notice that the axis starts at $36,000, not zero. The tool does that when the totals sit in a narrow band, so the steps are visible. The totals are still labelled in full, but read the bar heights with that in mind.
What comes back
Alongside the image, the tool returns text. For this request the text is the following, with the link left out:
Waterfall: Revenue grew $6,500 (+16%) from October to November, to $47,500. Paid search added $5,100, Email added $2,300 and Organic fell $900.   (source: template)
Start October $41,000 → End November $47,500; change +$6,500 (+15.9%).
Drivers, largest first: Paid search +$5,100, Email +$2,300, Organic -$900
Image: <link to the image>
The first line is the explanation and only appears when you ask for one. The rest is always there. Any warnings follow, and then a usage line. The two percentages differ only in rounding: the sentence rounds to a whole number, the totals line keeps one decimal.
Each call uses one render from your monthly allowance. Asking for an explanation also uses one of your monthly explanations.
The explanation: what it says and what it will not
Set explain and the response adds a written explanation. There are two kinds:
trueor"template": a sentence built directly from the numbers, as above. It names the four biggest movers and sums the rest."ai": the same facts reworded by a model. The wording is checked before you see it. If it contains a number that is not in the data, or language that guesses at a cause ("because", "due to", "driven by"), you get the template sentence and a warning instead. You also get the template sentence and a warning if AI wording is unavailable.
Template wording is English only: with another lang you get the English sentence and a warning. The "ai" option takes the language into account.
The explanation describes movement only. It does not say a campaign worked or a customer churned, because the data does not show that. Treat it as the first sentence of your analysis, then add what you know.
When the numbers do not add up
You can add start_total and end_total as checks. If they disagree with the items, nothing is quietly corrected. Say you send end_total: 48000 for the example above:
end_total is 48000, but the start total plus the changes is 47500 (off by 500).That arrives as a 400 with the numbers attached, so a typo in the source data shows up here and not in front of your boss. Mixed item shapes, duplicate names, and a start period that is all zeros are also 400s.
More than eight items
The chart shows the eight biggest movers by size of change, then one bar called "Other (n)" that holds the rest. The summary text lists the same drivers, largest first.
Match your brand
render_waterfall accepts a saved brand kit slug as brand. The start and end bars take the kit's first palette color. The rise and fall colors stay green and orange-red so direction is still readable. Branded charts from your website covers how to draft and save a kit.
Formats and sizes
PNG is the default. You can ask for JPEG, WebP, SVG or PDF. PDF needs Pro or Agency and comes back as a link, not inline. On Free the longest edge is capped at 1,200 pixels, so at the default 800 pixel width the chart renders at 1x. Paid plans default to the sharper 2x.
A monthly routine
A reasonable use of this tool is a close-of-month review:
- Paste this month's and last month's totals per category into your AI.
- Ask for the waterfall and the written explanation.
- Read the drivers, then add your own notes on the why.
- Ask for a link and post it in your team channel. Charts for Slack, Discord and Teams covers how each destination treats image links.
If that becomes a standing job, move it into an automation. The n8n guide shows the pattern, and Zapier and Make work the same way.
Which plan you need
The chart alone works on Free. The pieces this guide leans on are on Pro and Agency:
- Written explanations: 100 a month on Pro, 1,000 on Agency, none on Free.
- No chart-output.com mark on the image, which matters if the chart goes to a client or an exec.
- PDF output, and images up to 3,000 pixels.
Pro is $19 a month and Agency is $79. The pricing page has the full table, including render allowances, so you can size a plan to the loop you actually run.