 Chart-Output
Google Chart API Is Gone: What to Use Instead of chart.googleapis.com
Want to see the output first? Render a chart in the playground. No account needed.
If your old reports, emails or README files show broken images where charts used to be, the cause is almost always a URL that starts with https://chart.googleapis.com/chart? or https://chart.apis.google.com/chart?. That service is gone. We tested both hosts on November 18, 2026: a bar chart, a pie chart and a QR code all came back as HTTP 404.
This guide covers what happened, which replacement fits which job, and how to translate an old Google URL into a working one.
What happened to the Google Chart API
Google deprecated Image Charts in 2012, with availability guaranteed until April 2015 (Wikipedia). In February 2019 Google announced in its Google Chart API group that it would be turned off on March 14, 2019. Wikipedia gives March 18, 2019 as the date it actually went off.
In that announcement, Google suggested its JavaScript library Google Charts, D3, Dygraphs, or generating charts ahead of time and storing them. For QR codes, LaTeX equations and road signs, it said it had no suggested replacement.
Pick a replacement by what you need
| What you need | Good fit | Notes |
|---|---|---|
| Keep your old URLs and only change the host | Image-Charts | Its migration page says 23 of Google's 30 documented parameters work unchanged and lists the 6 with no equivalent. Its Free plan adds a small watermark; Business ($99 a month, or $89 billed yearly) removes it. |
| QR codes | QuickChart or Image-Charts | QuickChart has a /qr endpoint and also reads Google-style cht=qr URLs. Image-Charts reads cht=qr too. Chart-Output does not make QR codes. |
| Interactive charts on a web page | Google Charts | A JavaScript library that draws in the browser. No good for email, PDFs or chat apps, where you need an image. |
| An image URL you can rewrite once and keep | Chart-Output (this site), QuickChart or Image-Charts | All three accept a Chart.js config. Chart-Output takes it in the URL or as a POST body. |
If you have hundreds of URLs baked into templates you can't easily edit, a host swap to Image-Charts is the least work. If you are rewriting anyway, moving to Chart.js configs gets you a format that is documented, widely used, and easy to generate from code.
Translating a Google URL into Chart.js
Google described a chart with short query parameters. Chart.js describes it as JSON. Here is how the common parameters map. Chart-Output supports six chart types: line, bar, pie, doughnut, radar and polarArea.
| Google parameter | Example | Chart.js equivalent |
|---|---|---|
cht=lc (line) | cht=lc | "type": "line" |
cht=bvg / bvs (vertical bars, grouped / stacked) | cht=bvs | "type": "bar"; for stacked, set stacked: true on both options.scales.x and options.scales.y |
cht=bhg / bhs (horizontal bars) | cht=bhg | "type": "bar" plus "options": { "indexAxis": "y" } |
cht=p / p3 (pie, 3D pie) | cht=p3 | "type": "pie" (there is no 3D) |
cht=r (radar) | cht=r | "type": "radar" |
chs (size) | chs=600x300 | "width": 600, "height": 300 |
chd (data, text encoding) | chd=t:10,20|30,40 | One dataset per |-separated series: "datasets": [{ "data": [10, 20] }, { "data": [30, 40] }] |
chxl / chl (axis or slice labels) | chxl=0:|Jan|Feb | "data": { "labels": ["Jan", "Feb"] } |
chdl (legend entries) | chdl=Revenue|Target | "label" on each dataset |
chco (colors) | chco=4F46E5 | "backgroundColor" / "borderColor" on each dataset, with a #: "#4F46E5" |
chtt (title) | chtt=Signups | "options": { "plugins": { "title": { "display": true, "text": "Signups" } } } |
chdlp (legend position) | chdlp=b | "options": { "plugins": { "legend": { "position": "bottom" } } } |
chds (data scale) | chds=0,100 | Usually drop it, since Chart.js scales the axis itself. To fix the range: "options": { "scales": { "y": { "min": 0, "max": 100 } } } |
Two things to check before you start:
- Data encoding.
chd=t:is plain numbers. If your URLs usechd=s:(simple) orchd=e:(extended) encoding, decode them to numbers first. - Chart types with no equivalent. Scatter plots, maps, Google-o-meter gauges, Venn diagrams, QR codes and formulas don't map to Chart-Output's six types.
Chart-Output does not read Google's parameter format, so swapping the host on an old URL will not reproduce your chart. Rewrite each one using the table above.
Example 1: a simple bar chart
Here is a typical old URL for a vertical bar chart:
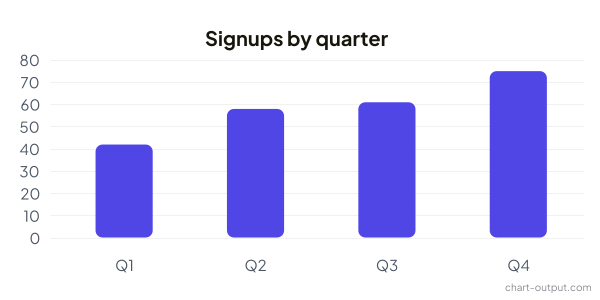
https://chart.googleapis.com/chart?cht=bvs&chs=600x300&chd=t:42,58,61,75&chxt=x,y&chxl=0:|Q1|Q2|Q3|Q4&chco=4F46E5&chtt=Signups+by+quarterFor a single series like this, Chart-Output's GET endpoint takes plain query parameters, so the rewrite stays a URL you can paste into an <img> tag:
https://www.chart-output.com/api/v1/render?type=bar&labels=Q1,Q2,Q3,Q4&data=42,58,61,75&width=600&height=300&backgroundColor=%234F46E5&datasetLabel=Signups&title=Signups%20by%20quarterLabels are comma-separated here, not pipe-separated, and the # in the color is written %23. That URL produced this image:
Example 2: more than one series
The query parameters above cover one dataset. For anything more (two lines, a stacked bar, custom options), put a Chart.js config in the URL as base64url-encoded JSON, using the c parameter.
Build the config once in code:
const config = {
  type: 'line',
  width: 600,
  height: 300,
  data: {
    labels: ['Jan', 'Feb', 'Mar', 'Apr', 'May', 'Jun'],
    datasets: [
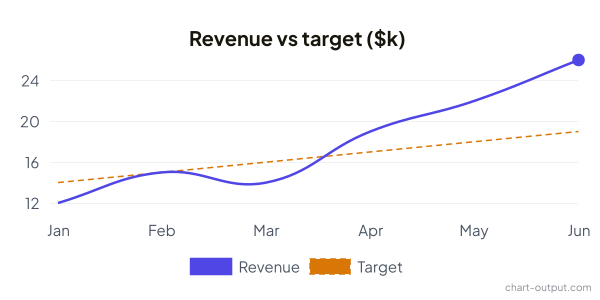
      { label: 'Revenue', data: [12, 15, 14, 19, 22, 26], borderColor: '#4F46E5', backgroundColor: '#4F46E5', borderDash: [] },
      { label: 'Target', data: [14, 15, 16, 17, 18, 19], borderColor: '#D97706', backgroundColor: '#D97706', borderDash: [6, 4] },
    ],
  },
  options: {
    plugins: {
      title: { display: true, text: 'Revenue vs target ($k)' },
      legend: { display: true, position: 'bottom' },
    },
  },
};

const c = Buffer.from(JSON.stringify(config)).toString('base64url');
const url = `https://www.chart-output.com/api/v1/render?c=${c}`;
The same in Python, with config as a dict holding the same keys:
import base64, json

c = base64.urlsafe_b64encode(json.dumps(config).encode()).decode().rstrip("=")
url = f"https://www.chart-output.com/api/v1/render?c={c}"
That config rendered as:
Limits to know before you ship
- URLs without a key render PNG only, up to 1,200 px on each side, with a small chart-output.com mark in the corner (visible in both images above), and are rate limited by IP address.
- Adding
?key=to the URL gives you your plan's formats and sizes, but anyone who can see the URL can see the key. For emails and public pages, render on your server instead: send a POST with"returnUrl": trueand put the hosted image URL it returns in your<img>tag. Chart.js in email walks through that. - GET URLs are capped at 2,000 characters. A large config won't fit in a URL; send it as a POST body.
Free accounts get 1,000 renders a month with the watermark and a 1,200 px limit. Pro is $19 a month for 25,000 renders, no watermark, 3,000 px, and adds PDF output. See pricing for the rest.
Which one should you choose?
- You can't touch the URLs, or there are too many: move them to Image-Charts with a host swap, and check its list of unsupported parameters.
- You mostly made QR codes: QuickChart or Image-Charts.
- The chart lives on a web page and should be interactive: Google Charts or another JavaScript library.
- You are rewriting anyway and want Chart.js configs, SVG or WebP output, or charts in your brand's colors and logo: that's what Chart-Output is built for. Try a config in the playground before writing any code.
If you are weighing hosted Chart.js services against each other, QuickChart alternatives and Image-Charts vs Chart-Output compare prices and features, checked against each vendor's own pages.