 Chart-Output
Turn a CSV into a chart inside Claude, Cursor or Windsurf (MCP setup)
Want to see the output first? Render a chart in the playground. No account needed.
You have numbers in a CSV and need a picture of them. The usual route is a spreadsheet, the chart wizard, an export, and a paste into whatever you are writing.
With the Chart-Output MCP server installed, you paste the rows into your AI chat, say what you want to see, and the image comes back in the conversation. This guide covers the setup, three prompts to try, and the errors you may meet.
What you are setting up
MCP (Model Context Protocol) is how an AI app discovers tools it can call. The Chart-Output server gives your AI tools that render charts and hand back the image. You do not call them yourself: you describe the chart, and the AI chooses a tool and fills in its arguments.
The server renders; it does not read your files. Your AI reads the CSV and sends the labels and numbers across.
Setup: one config block
You need Node.js 18 or newer and an API key. Create a free account, then create a key on the API Keys page. Free needs no credit card.
Add this to your editor's MCP config:
{
  "mcpServers": {
    "chart-output": {
      "command": "npx",
      "args": ["@chartoutput/mcp"],
      "env": {
        "CHART_OUTPUT_API_KEY": "YOUR_API_KEY"
      }
    }
  }
}
The config file lives in a different place for each client, and VS Code uses a servers key instead of mcpServers. The MCP setup guide has a tab for Claude Code, Cursor, VS Code and Windsurf. Restart the editor so it picks up the server.
Prompt 1: check that it works
Ask for something small, with the data in the prompt:
Create a bar chart showing Q1 through Q4 revenue: 120k, 145k, 132k, 178kYou should see an image in the chat. A 401 means the key is missing or wrong in the config.
Prompt 2: paste a CSV and say what you want to see
Paste the rows, then describe the point of the chart rather than the chart type:
Chart these weekly signups as bars with the values on top.
Mark the week with the biggest jump over the week before.

week,signups
W1,120
W2,138
W3,151
W4,149
W5,176
W6,190
The numbers are sample data. Your AI turns the table into labels and a dataset and calls render_chart. Here is one valid version of that call, with the output it produced:
{
  "type": "bar",
  "labels": ["W1", "W2", "W3", "W4", "W5", "W6"],
  "datasets": [{ "label": "Signups", "data": [120, 138, 151, 149, 176, 190] }],
  "header": { "title": "Weekly signups", "subtitle": "Sample data, six weeks" },
  "dataLabels": true,
  "annotations": [
    { "x_start": "W4", "x_end": "W5", "style": "band", "label": "Biggest jump: +27" }
  ],
  "width": 600,
  "height": 380,
  "scale": 2,
  "textScale": 1.3
}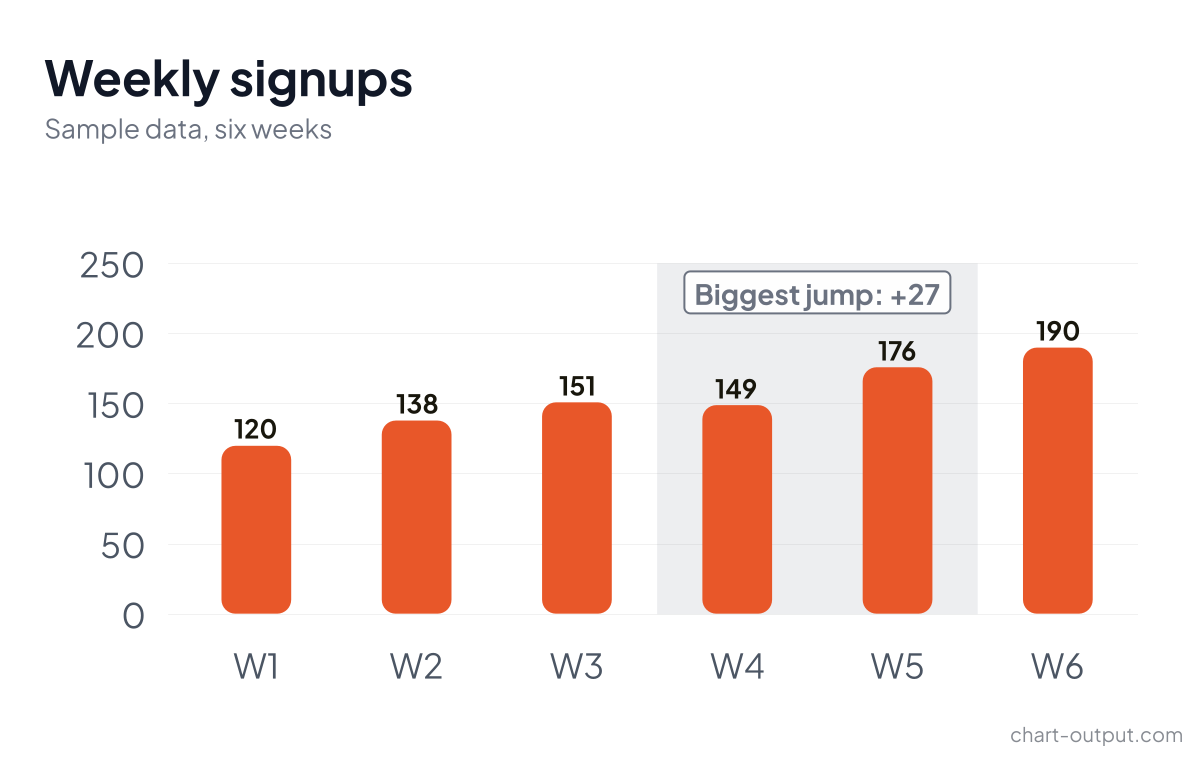
Rendered from the call above on a Free plan, so the small chart-output.com mark is in the corner. Your AI will make its own choices; treat the call as an example, not a transcript.
W4 to W5 is the largest step (149 to 176, so +27). The other weeks moved by +18, +13, -2 and +14. Follow-ups in plain words work from here: "color the last bar differently", "add a target line at 180", "make the title shorter". Datasets keep any styling keys your AI sends, so per-bar colors and a second line series pass through to the renderer.
Prompt 3: start from a proven design
If you know the business question but not the chart, ask your AI to look at the gallery first:
I want to show which channels bring in signups. Look at the Chart-Output
gallery and pick a design that fits.
The list_gallery_charts and get_gallery_chart tools need no API key. Each gallery entry says when to use it, what it shows, and what shape of data it needs, so the AI can pick one and fill it with your numbers. Gallery charts are not the API's template ids, even when the names match, so say which you mean if you move between them.
Habits that save time
- Say where the image is going.
render_chartreturns the image inline.render_chart_urlreturns a public link instead. "For a Slack message" or "for an email" steers your AI to the link. Links are public, so keep sensitive numbers inline. - Ask for alt text when the chart will be published. The result then includes a description of the chart. The template description is free on every plan. An AI-written one counts against a monthly allowance: 50 on Free, 1,000 on Pro.
- Ask for a color-blind-safe palette when the audience is wide. It applies to series you did not color yourself.
- Keep labels and values the same length. A mismatch is not rejected by default, so the chart renders with gaps. If you are unsure about your data, ask your AI to set repair mode and tell you what it fixed.
- Event markers have limits. Annotations like the band above work on line and bar charts with a category x-axis. They are rejected on horizontal bars, pie, doughnut, radar and polar area charts.
When something fails
Errors come back as plain text, so your AI can explain them to you:
| What you see | What it means |
|---|---|
| 401 | The API key is missing or invalid in your MCP config. |
| 402 | The monthly allowance is used up. The message has the reset date and an upgrade link. Do not retry. |
| 403 | Your plan does not include what you asked for: PDF, an image over 1,200 pixels on Free, or plain-English charts on Free. Do not retry the same request. |
| 400 | The spec is invalid. The text lists each failing field with its path. |
| 429 | Too many requests: the limit is 100 per 15 minutes per key. Wait for the time in Retry-After. |
Try it with your own CSV
Create a free key, paste the config block above, and give your AI the CSV you were about to open in a spreadsheet. Free covers 1,000 renders a month, which is plenty to find out whether this fits how you work.
Where to go next
- Ask what changed between two periods with a waterfall chart.
- Make the charts look like your company with a brand kit drafted from your website.
- Put the chart in a recurring workflow with n8n or Zapier and Make.
- Send the result to chat with charts for Slack, Discord and Teams, or into an inbox with Chart.js charts in email.
- Read the pricing page before you size a plan to a loop that renders every day.