 Chart-Output
Branded charts that match your website, as a shareable link
Want to see the output first? Render a chart in the playground. No account needed.
A chart in your company's colors, with your logo on it, reads as yours. A default-styled one reads as borrowed. The cost has always been setup: hex codes, a font name, a logo file, all collected before you can draw anything.
The Chart-Output MCP server can draft those from your website. This guide walks through the flow: draft a brand kit, review it, save it, then ask your AI for charts that use it and hand back links. If the server is not installed yet, start with the CSV setup guide.
Step 1: draft a brand kit from your site
Ask your AI:
Create a Chart-Output brand kit from https://yourcompany.com. Show me the
draft before saving anything.
The AI calls create_brand_kit_from_url. You get a draft with the name, slug, palette, background, text and grid colors, font and logo. Each field comes with a confidence and a source where the API provides them, so you can tell what was read from the page and what was a guess. Treat it as a draft to check, not a guaranteed match.
By default nothing is saved. Three limits to know:
- Each lookup that finds something uses one of your plan's monthly website extractions: 1 on Free, 10 on Pro, 50 on Agency. Blocked, failed or empty lookups are not counted.
- Private and internal addresses are refused.
- If the page gives fewer than two colors, the draft cannot be saved and you get a warning.
Step 2: review, then save
Read the draft. If the palette is off, say so and ask for a different source page, or adjust the colors with your AI. When it looks right, tell your AI to save it, and tell it the slug you want: lowercase letters, digits and hyphens, up to 48 characters.
Saving stores the kit on your account and counts toward your plan's kit limit, so your AI should ask first. You can see what you have at any time:
List my Chart-Output brand kits.The list shows each kit's slug, name, palette, font and logo, and flags a kit as locked if it is over your plan's limit.
Step 3: render with the brand
Pass the kit's slug when you ask for a chart. The example below uses a slug called acme. Swap in one of your own.
Render a line chart of monthly active users, January to June, using the acme
brand kit. Add a header "Monthly active users", a KPI strip with the latest
figures, and a footer with our site name. Give me a link.
Your AI calls render_chart_url with the slug as brand. This is the call behind the image below. The numbers are sample data:
{
  "type": "line",
  "labels": ["Jan", "Feb", "Mar", "Apr", "May", "Jun"],
  "datasets": [
    { "label": "Monthly active users", "data": [12400, 13100, 14000, 15200, 16100, 17300] }
  ],
  "brand": "acme",
  "header": { "title": "Monthly active users", "subtitle": "January to June, sample data" },
  "kpiStrip": [
    { "label": "Active users, Jun", "value": "17,300" },
    { "label": "Added since Jan", "value": "+4,900" },
    { "label": "Average per month", "value": "+980" }
  ],
  "footer": { "left": "Sample data", "right": "acme.example" },
  "width": 696,
  "height": 460,
  "scale": 2,
  "textScale": 1.35
}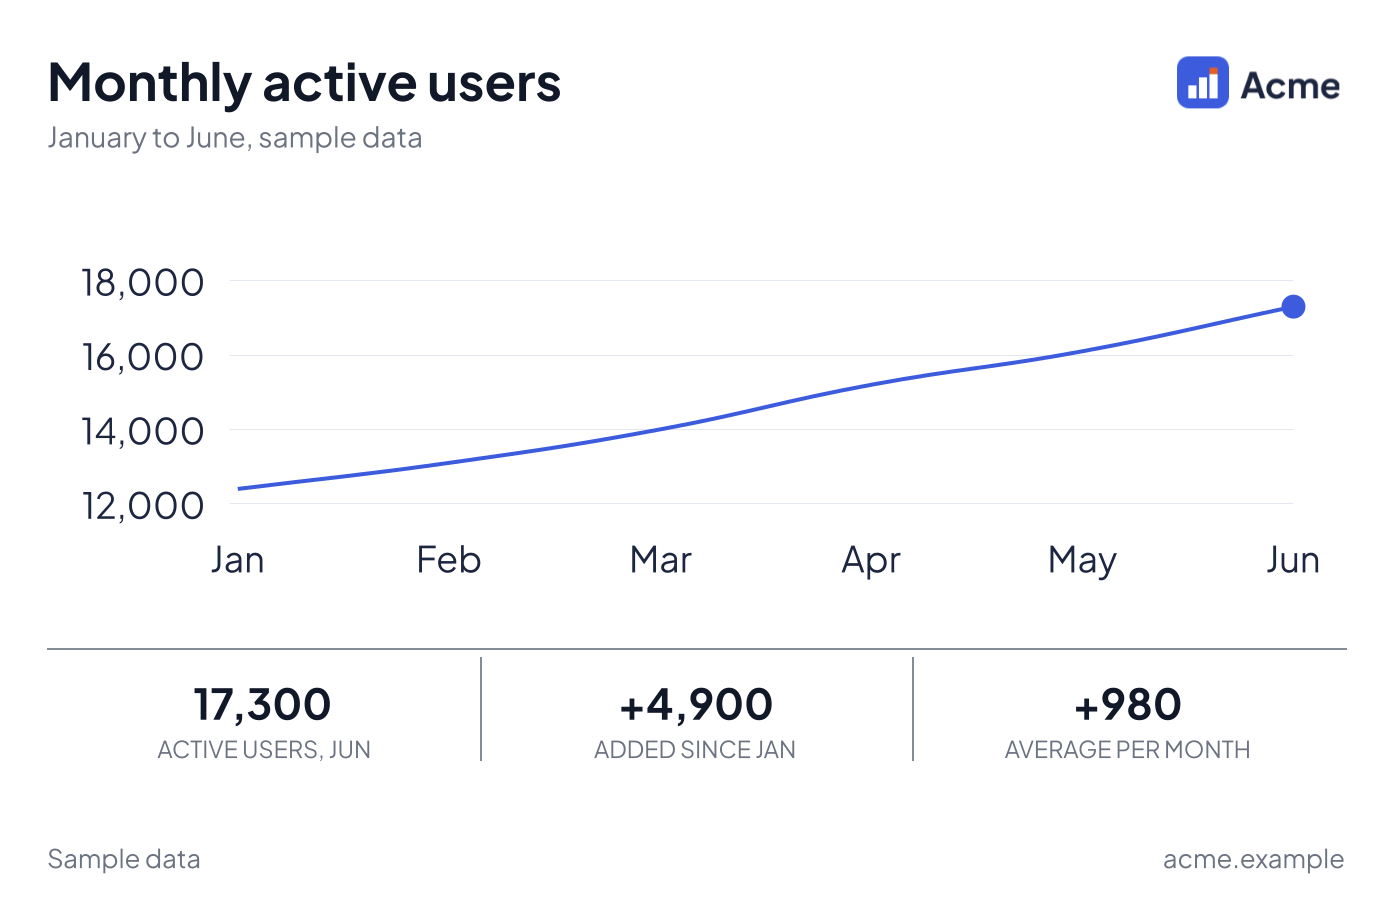
Rendered from the call above with a sample kit called acme, a made-up company whose logo is drawn for this site's gallery. Paid plan, so no watermark. With your own slug, the palette, logo and font come from your kit.
The call returns a plain HTTPS link to the image, which you can paste into Slack, an HTML email, a doc or a ticket. The kit supplies:
- the palette, for any series you did not color yourself
- the background, text and grid colors
- the font, if the kit uses one of the bundled fonts (anything else renders in the default font)
- the logo
Anything you set explicitly, such as a dataset color, wins over the kit.
Header, KPI strip and footer
The render tools accept a header, a KPI strip and a footer, so one image can carry the headline and the supporting numbers. A KPI strip is up to 12 items, each a label and a value, and every value is a string. There is no delta field. If you want "up 39.5%", write it into a value ("17,300 (+39.5%)") or the header subtitle.
Any header, KPI strip, footer, border or legend turns the output into a card. A card cannot be SVG: an SVG request comes back as PNG.
What brand does on cards, waterfalls and the shipped examples
brand is read by the API on every render request, so it is not specific to render_chart_url. It works through render_chart, render_chart_url, render_card, render_card_url, render_chart_ai and render_waterfall. A few details decide how it looks:
- In the card tools,
brandgoes inside the spec, next totype,dataandheader. - The logo goes in the card header, on the side the kit sets, unless the spec sets its own
header.logoUrl. On a plain chart with no header, the logo is drawn over a corner of the image and can cover data near that corner. If that matters, add a header. - Explicit colors beat the kit. The specs from
get_chart_exampleare dark cards with a preset and colors written into the spec. Addingbrandto one gives a mixed result: the kit's white background behind text and series colors the example chose for a dark card, so some of it is hard to read. For a branded card, ask your AI to build the spec without colors, as in the call above. - Waterfalls keep green and orange-red for rises and falls and take the kit's first palette color for the start and end bars. See what changed this month, as a waterfall.
The same slug works from the REST API too. Send it as brand in the JSON body of an n8n HTTP Request node or a Make HTTP module (Zapier and Make guide).
Link or inline image?
| You want | Ask for |
|---|---|
| To look at it in the chat | An inline image (render_chart or render_card) |
| To paste it elsewhere | A link (render_chart_url or render_card_url) |
| A PDF | A link with format pdf, on Pro or Agency |
Links are public. If a chart contains numbers you would not post in public, keep it inline and share the file another way. Charts for Slack, Discord and Teams and Chart.js charts in email cover how each destination treats image links, and PDF reports covers the PDF side.
Limits to keep in mind
- Free images carry a small watermark and the longest edge (width or height, times scale) is capped at 1,200 pixels. Pro and Agency remove the watermark and allow 3,000.
- An unknown brand slug is a 404 that lists the slugs that exist. Never a silent fallback.
- If a downgrade leaves you with more kits than your plan includes, the extra ones are kept but locked. Rendering with a locked kit is a 403.
- Preset looks (obsidian, linen, polar, studio, ember, harbor) are set with
extensions.brandKitId, notbrand. Tell your AI which one you mean.
Which plan you need
Free gives you one kit and one website draft a month, with the watermark on every image. That is enough to see whether the flow works for your site. Pro and Agency are for charts you hand to other people:
- Pro: 3 brand kits, 10 website drafts a month, no watermark, PDF output and images up to 3,000 pixels.
- Agency: 15 brand kits (each extra kit is $5 a month) and 50 website drafts a month, for keeping a kit per client.
Pro is $19 a month and Agency is $79. The pricing page has the full comparison.