 Chart-Output
- 1 Pick a chart
- 2 Make it yours

Alt text for this chart
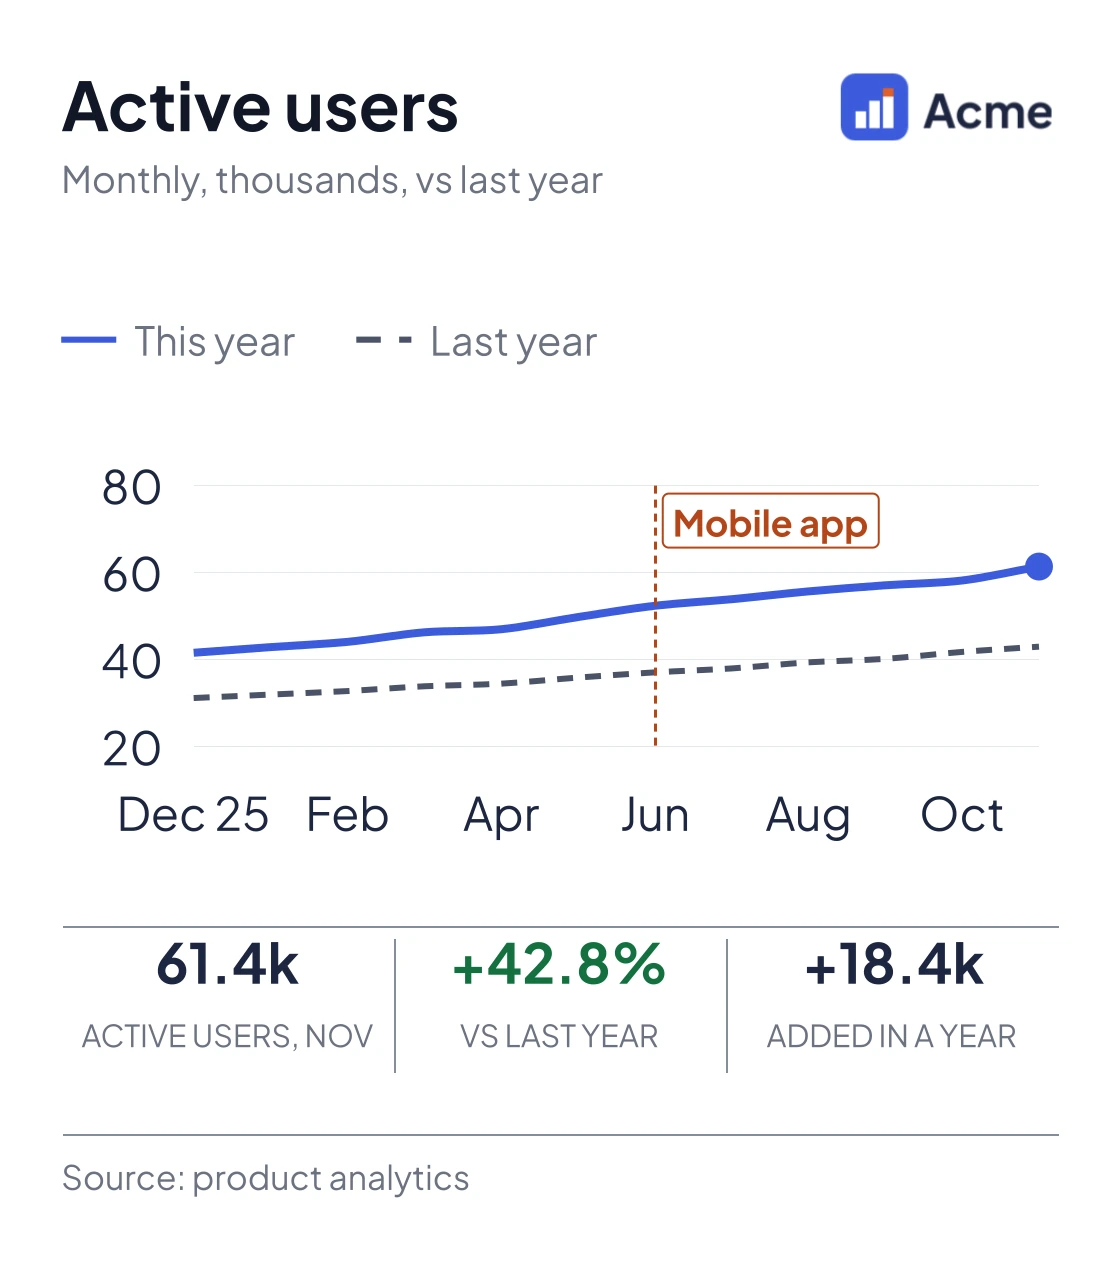
Line chart of monthly active users in thousands, this year against last year. This year, a solid line, rose from 41.6k in December to 61.4k in November. Last year, dashed, went from 31.2k to 43.0k, so users are up 42.8% year on year. A marker at June shows the mobile app launch.Line, two series chart · One API request
Active users, year on year
This year against last on one chart, with last year dashed so the gap between them is the story. Change the numbers and the request below follows. Send it from Make, n8n, Zapier or a script, and the image comes back.
Columns: Month, This year, Last year. Paste rows from a sheet, or type one per line. Users in thousands (41.6) or whole (41,600).
2. The request that makes it
{
  "type": "line",
  "width": 560,
  "height": 640,
  "textScale": 1.8,
  "format": "png",
  "devicePixelRatio": 2,
  "legend": {
    "display": true,
    "position": "top",
    "style": "line",
    "fontSize": 13
  },
  "data": {
    "labels": ["Dec 25", "Jan 26", "Feb", "Mar", "Apr", "May", "Jun", "Jul", "Aug", "Sep", "Oct", "Nov"],
    "datasets": [
      {
        "label": "This year",
        "data": [41.6, 42.9, 44.1, 46.3, 47, 49.8, 52.4, 53.9, 55.7, 57.1, 58.2, 61.4],
        "order": 0,
        "borderColor": "#3c5cdd",
        "backgroundColor": "#3c5cdd",
        "borderWidth": 4,
        "tension": 0.3,
        "fill": false,
        "pointRadius": [0, 0, 0, 0, 0, 0, 0, 0, 0, 0, 0, 5],
        "pointBackgroundColor": "#3c5cdd"
      },
      {
        "label": "Last year",
        "data": [31.2, 32, 32.8, 33.9, 34.5, 35.9, 37.1, 38, 39.4, 40.2, 41.8, 43],
        "order": 1,
        "borderColor": "#4a5368",
        "backgroundColor": "#4a5368",
        "borderWidth": 3,
        "borderDash": [8, 6],
        "tension": 0.3,
        "fill": false,
        "pointRadius": 0
      }
    ]
  },
  "annotations": [
    {
      "x": "Jun",
      "label": "Mobile app",
      "color": "#b4461a"
    }
  ],
  "options": {
    "plugins": {
      "tooltip": {
        "enabled": false
      }
    },
    "scales": {
      "x": {
        "grid": {
          "display": false
        },
        "border": {
          "color": "#e3e7ef"
        },
        "ticks": {
          "color": "#4a5368",
          "maxRotation": 0,
          "autoSkip": true,
          "maxTicksLimit": 6
        }
      },
      "y": {
        "beginAtZero": false,
        "grace": "8%",
        "border": {
          "display": false
        },
        "grid": {
          "color": "#e3e7ef",
          "drawTicks": false
        },
        "ticks": {
          "color": "#4a5368",
          "padding": 8,
          "maxTicksLimit": 5
        }
      }
    }
  },
  "kpiStrip": [
    {
      "label": "Active users, Nov",
      "value": "61.4k",
      "color": "#1d2640"
    },
    {
      "label": "Vs last year",
      "value": "+42.8%",
      "color": "#13703f"
    },
    {
      "label": "Added in a year",
      "value": "+18.4k",
      "color": "#1d2640"
    }
  ],
  "footer": {
    "left": "Source: product analytics",
    "borderTop": true
  },
  "header": {
    "title": "Active users",
    "subtitle": "Monthly, thousands, vs last year",
    "logoUrl": "https://www.chart-output.com/gallery/acme-logo.png",
    "logoHeight": 22
  },
  "theme": {
    "backgroundColor": "#ffffff",
    "textPrimary": "#1d2640",
    "textSecondary": "#4a5368",
    "gridColor": "#e3e7ef",
    "mode": "light"
  }
}
It carries this chart's colours in theme, so it runs on any account. To use your own logo and colours, swap theme for "brand": "your-kit-slug" (brand kits).
1,000 renders a month free. No card.
About this chart
- When to pick it
- Use it for any year-on-year comparison where the gap between the two lines is what people should see.
- The data it takes
- Columns: Month, This year, Last year. 2 to 24 rows. Users in thousands (41.6) or whole (41,600).
- What it shows off
- Line, two series, under Customers. Brand kit, Dashed comparison series, Event annotation, KPI strip.
- For scripts and agents
- This chart's request (JSON) · This page as Markdown · Every chart (JSON)
Questions
about this chart.
How do I make this active users, year on year chart with my own data?
Paste your numbers into the box on this page and the chart and its request update. To make it from your own workflow, send that request to POST https://www.chart-output.com/api/v1/render with a free API key; the response is the image.
What data does it take?
Columns: Month, This year, Last year. 2 to 24 rows. Users in thousands (41.6) or whole (41,600).
Can ChatGPT or Claude make this chart?
Yes. Add https://www.chart-output.com/mcp as a custom connector and ask for the chart; its render_chart tool takes this page's request and returns the image, with no API key. Or use "Copy prompt for your AI" on this page.
What does it cost?
The free plan includes 1,000 renders a month, with no card. Paid plans add more renders and remove the watermark.
What do I get back?
A finished image: PNG by default, or SVG, WebP or JPEG, and PDF on Pro. Set "format" in the request.
Or start from another chart
Churn vs targetMonthly logo churn with the months above target in a second colour and the fix marked.BarCustomer satisfactionHow satisfaction splits each quarter, every row scaled to 100% with the share printed on each segment.100% stacked barPipeline by stageOpen pipeline value by sales stage, with the value printed on every bar for the weekly sales call.BarQuota attainment by repEvery rep ranked by attainment, with a line at quota and the reps below it in a second colour.Ranked horizontal barWin rate with a rolling averageWeekly win rate with a four-week average on top, so the trend shows through the week-to-week noise.Line with moving averagePut it in a workflow
Add a chart to an n8n workflowGoogle Sheets rows to a chart image in Slack or email, with one Code node and one HTTP Request node.GuideChart.js in emailRender a Chart.js config as a static PNG that shows in Gmail, Outlook and Apple Mail.GuideBranded charts from your website, as a linkDraft a brand kit from your site with one prompt, then get on-brand chart links from your AI.GuideAdd this chart to
your next report.
Send the request from the workflow that builds the report. 1,000 free renders a month, no card.
Get a free API keyEvery plan resets monthly. No automatic overage charges.