 Chart-Output
- 1 Pick a chart
- 2 Make it yours

Alt text for this chart
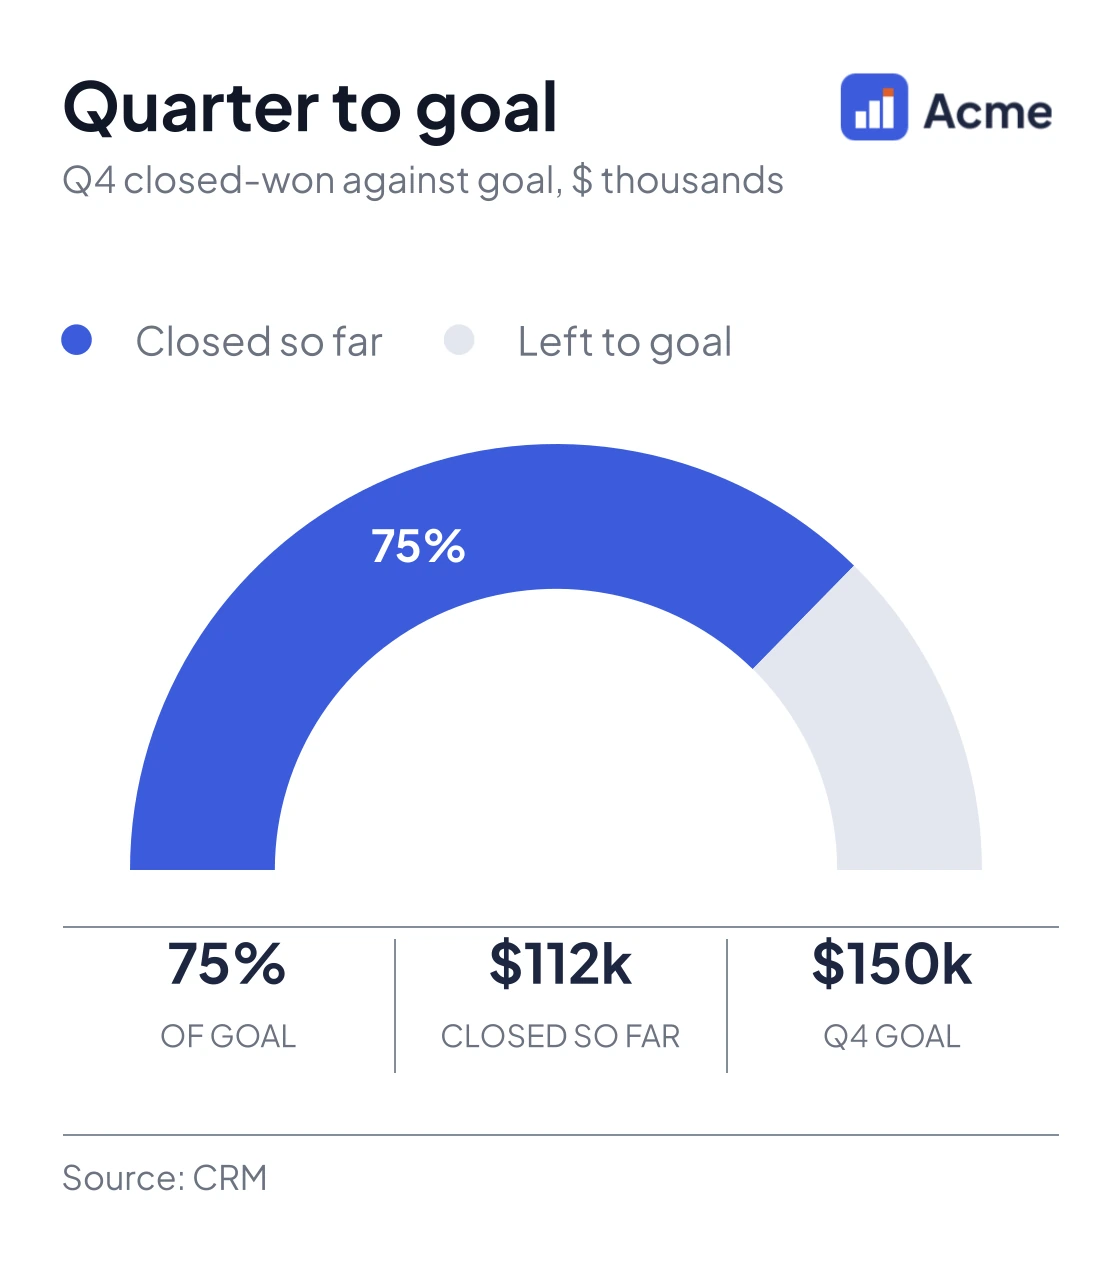
Half-doughnut gauge of Q4 closed-won revenue against its goal: $112k of $150k, which is 75% of the goal, with $38k still to win.Gauge chart · One API request
Quarter to goal
One number against its goal: a half-doughnut gauge with the attainment on the arc and the amounts in the strip. Change the numbers and the request below follows. Send it from Make, n8n, Zapier or a script, and the image comes back.
Columns: Item, Value. Paste rows from a sheet, or type one per line. Two rows: what you have so far, then the goal. In $ thousands, or in dollars.
2. The request that makes it
{
  "type": "doughnut",
  "width": 560,
  "height": 640,
  "textScale": 1.8,
  "format": "png",
  "devicePixelRatio": 2,
  "legend": {
    "display": true,
    "position": "top",
    "style": "square",
    "fontSize": 13
  },
  "dataLabels": true,
  "data": {
    "labels": ["Closed so far", "Left to goal"],
    "datasets": [
      {
        "label": "Goal",
        "data": [112, 38],
        "backgroundColor": ["#3c5cdd", "#e3e7ef"],
        "borderWidth": 0
      }
    ]
  },
  "options": {
    "rotation": -90,
    "circumference": 180,
    "cutout": "66%",
    "plugins": {
      "tooltip": {
        "enabled": false
      },
      "datalabels": {
        "anchor": "center",
        "align": "center",
        "offset": 0,
        "color": ["#ffffff", "rgba(255,255,255,0)"],
        "font": {
          "size": 22,
          "weight": "700"
        },
        "numberFormat": {
          "share": "total",
          "style": "percent"
        }
      }
    }
  },
  "kpiStrip": [
    {
      "label": "Of goal",
      "value": "75%",
      "color": "#1d2640"
    },
    {
      "label": "Closed so far",
      "value": "$112k",
      "color": "#1d2640"
    },
    {
      "label": "Q4 goal",
      "value": "$150k",
      "color": "#1d2640"
    }
  ],
  "footer": {
    "left": "Source: CRM",
    "borderTop": true
  },
  "header": {
    "title": "Quarter to goal",
    "subtitle": "Q4 closed-won against goal, $ thousands",
    "logoUrl": "https://www.chart-output.com/gallery/acme-logo.png",
    "logoHeight": 22
  },
  "theme": {
    "backgroundColor": "#ffffff",
    "textPrimary": "#1d2640",
    "textSecondary": "#4a5368",
    "gridColor": "#e3e7ef",
    "mode": "light"
  }
}
It carries this chart's colours in theme, so it runs on any account. To use your own logo and colours, swap theme for "brand": "your-kit-slug" (brand kits).
1,000 renders a month free. No card.
About this chart
- When to pick it
- Use it for a single "how far to goal" number in a weekly digest, a Slack post or a report cover.
- The data it takes
- Columns: Item, Value. 2 to 2 rows. Two rows: what you have so far, then the goal. In $ thousands, or in dollars.
- What it shows off
- Gauge, under Efficiency and goals. Brand kit, Half doughnut, Data labels, KPI strip.
- For scripts and agents
- This chart's request (JSON) · This page as Markdown · Every chart (JSON)
Questions
about this chart.
How do I make this quarter to goal chart with my own data?
Paste your numbers into the box on this page and the chart and its request update. To make it from your own workflow, send that request to POST https://www.chart-output.com/api/v1/render with a free API key; the response is the image.
What data does it take?
Columns: Item, Value. 2 to 2 rows. Two rows: what you have so far, then the goal. In $ thousands, or in dollars.
Can ChatGPT or Claude make this chart?
Yes. Add https://www.chart-output.com/mcp as a custom connector and ask for the chart; its render_chart tool takes this page's request and returns the image, with no API key. Or use "Copy prompt for your AI" on this page.
What does it cost?
The free plan includes 1,000 renders a month, with no card. Paid plans add more renders and remove the watermark.
What do I get back?
A finished image: PNG by default, or SVG, WebP or JPEG, and PDF on Pro. Set "format" in the request.
Or start from another chart
LTV vs CAC by channelWhat a customer is worth beside what they cost to win, for each channel, with the ratio in the strip.Grouped horizontal barSupport tickets by priorityA year of support tickets stacked by priority: the total load climbing while the high-priority band shrinks.Stacked areaRecurring revenueA board-ready MRR chart with the month you launched annual plans marked on it.LineRevenue by planHow November MRR splits across plans, with each share printed on the chart.DoughnutRevenue bridgeWhat moved MRR from December to November: new business and upsell added, downsell and churn taken off, as steps.WaterfallPut it in a workflow
Turn a CSV into a chart in Claude, Cursor or WindsurfAdd the MCP server once, paste a CSV, get a chart image back. Setup, three prompts and common errors.GuideAdd a chart to an n8n workflowGoogle Sheets rows to a chart image in Slack or email, with one Code node and one HTTP Request node.GuideChart.js in emailRender a Chart.js config as a static PNG that shows in Gmail, Outlook and Apple Mail.GuideAdd this chart to
your next report.
Send the request from the workflow that builds the report. 1,000 free renders a month, no card.
Get a free API keyEvery plan resets monthly. No automatic overage charges.